Dashboard
The HLE dashboard is your central control panel for managing tunnels, API keys, access rules, and monitoring usage. Access it at hle.world/dashboard after signing in.
Overview
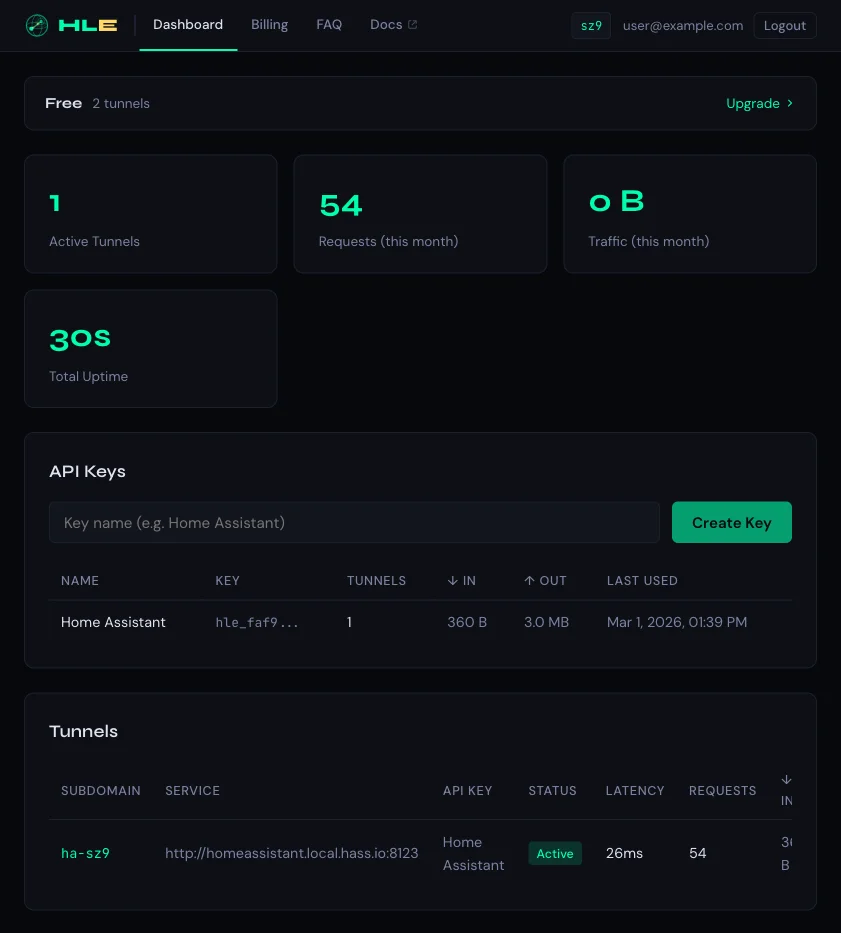
After logging in, the dashboard shows your account tier, live usage statistics, API keys, and active tunnels — all on a single page.
Usage statistics
The top of the dashboard displays four live counters for the current billing period:
- Active Tunnels — currently connected tunnel count
- Requests — total HTTP and WebSocket requests this month
- Traffic — total inbound data volume this month
- Total Uptime — cumulative tunnel uptime across all tunnels
Your account tier is shown in the header bar (e.g. Free or PAYG). All plan values (bandwidth, webhooks, log retention, share links) are configured on the server and displayed dynamically — see Pricing for the latest details.
Free tier
- Unlimited tunnels and webhook tunnels
- 2 GB bandwidth/month (hard cap)
- 10 free webhook requests/minute
- 7-day access log retention
- Share links: 100 active, up to 7 days each
Pay-as-you-go (PAYG)
- Everything in Free
- 2 GB free/month, then credit-based bandwidth
- 10 webhook requests/minute free, then €0.50 per 1,000 requests from credits
- Up to 30-day access log retention
Share links are the same on both plans — they are not a paid feature.
API key management
API keys authenticate your tunnel clients (CLI or Home Assistant add-on) with the HLE relay server. Each key has its own tunnel limit and usage tracking.
Creating a key
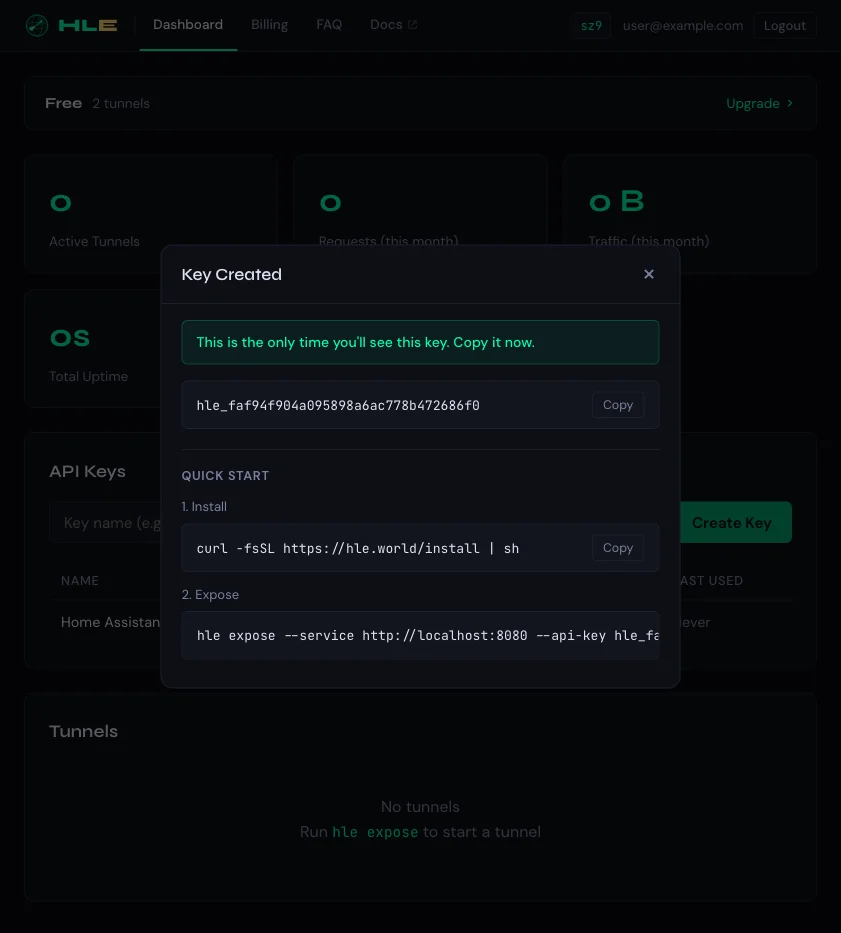
Type a descriptive name (e.g. “Home Assistant”, “Dev Server”) and click Create Key. The raw key is shown only once — copy it immediately. The dialog also shows Quick Start commands to install the CLI and start a tunnel.
Key table
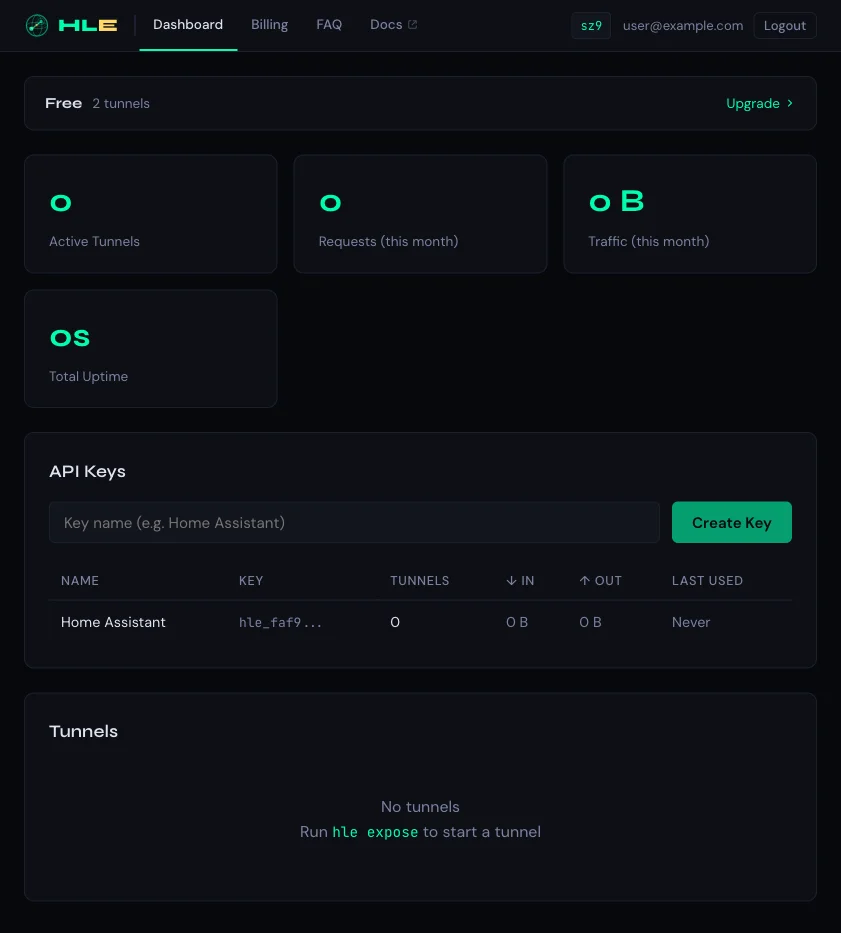
All your keys are listed in a table showing the key prefix, active tunnel count, data in/out, and last-used timestamp. Click a row to expand key details.
Key details
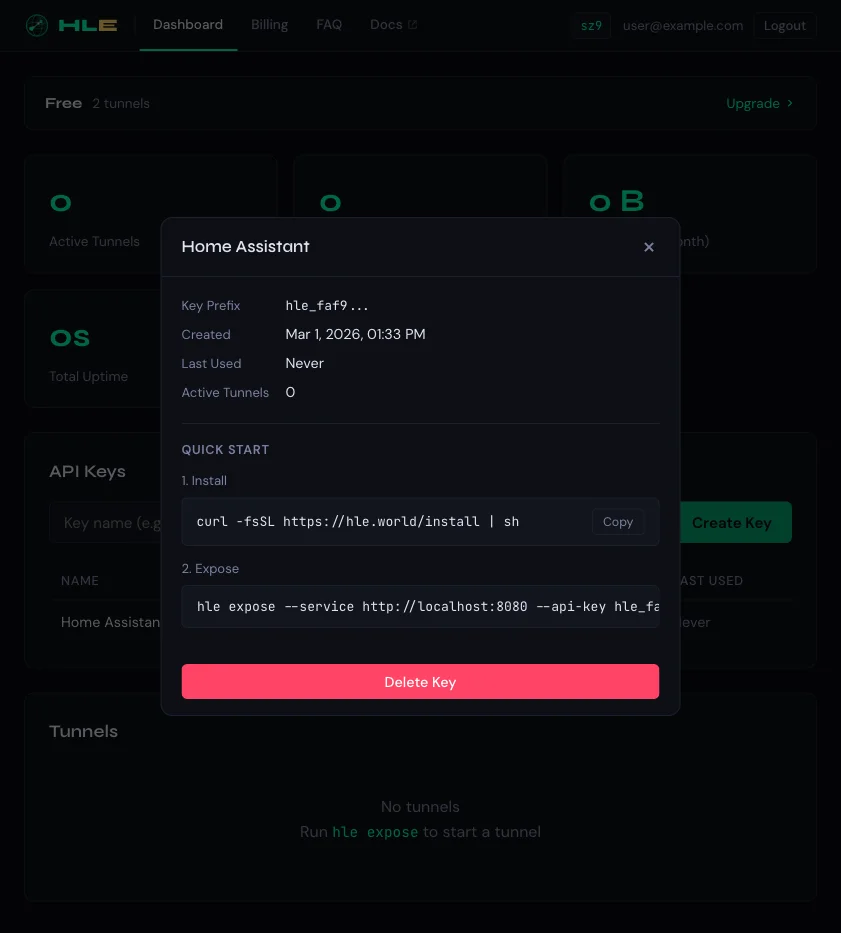
Clicking a key row opens its detail panel with the key prefix, creation date, last-used time, active tunnel count, and Quick Start commands. You can delete the key from here — this revokes it immediately and disconnects any active tunnels using it.
Tunnel list
The Tunnels section shows every tunnel connected to your account:
- Subdomain — the public URL prefix (e.g.
ha-sz9) - Service — the proxied backend URL
- API Key — which key authenticated this tunnel
- Status — Active (green) or disconnected
- Latency — round-trip time to the relay server
- Requests — total requests handled by this tunnel
- Traffic — data in and out columns
Authentication
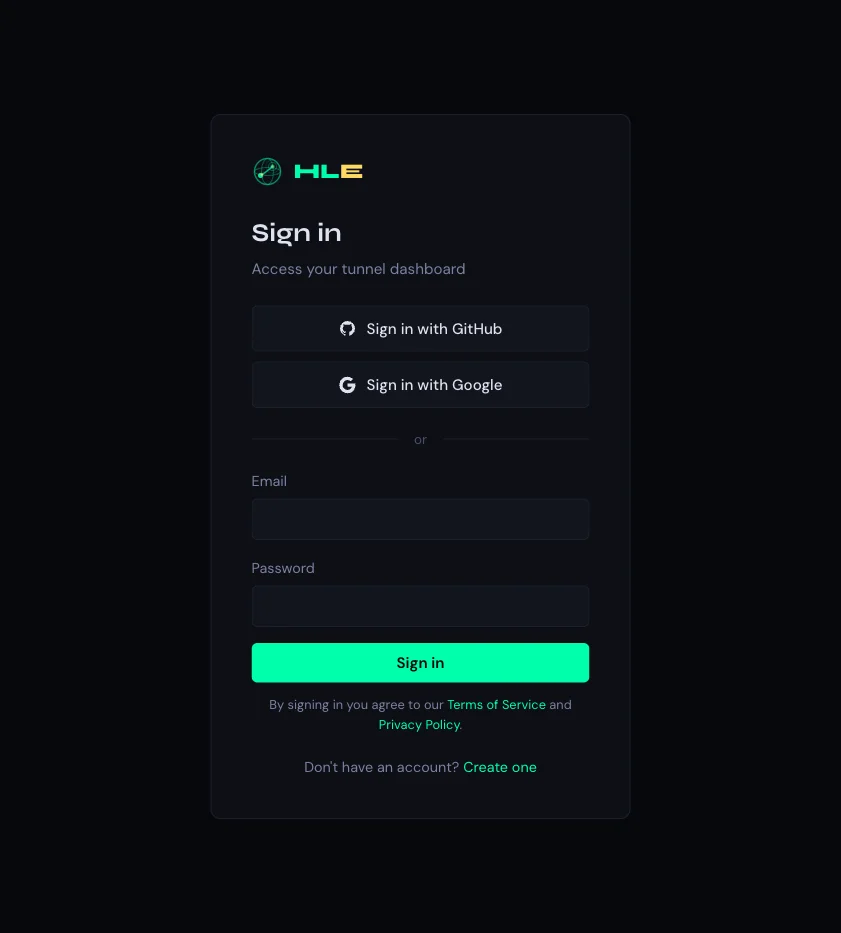
Sign in with GitHub, Google, or an email/password account. SSO providers link automatically — signing in with GitHub and then Google using the same email merges both into one account.
Per-tunnel access control
Each tunnel’s Access Control tab shows one ordered list of rules, in the order the relay evaluates them, with a sentence above it stating who can reach the endpoint right now. The first rule that matches decides.
- Sign-in: email + provider (any/github/google/hle) — the visitor signs in and is let through if their address matches
- PIN: a numeric code, no account needed
- Password: HTTP Basic Auth, checked before sign-in rules and the PIN, so setting one makes those unreachable
- Address: a visitor from an allow-listed address skips the gate — useful for a monitoring probe, which cannot sign in
- Share link: a temporary URL that lets anyone holding it in
Every rule can show the visits it was responsible for, and the last line — what happens to a visitor who matched nothing — has its own log of everyone turned away. Rules that are configured but can never be reached are shown greyed with the reason.
Defaults for every endpoint
- Refuse unmatched visitors — on by default. A visitor matching no rule is turned away. With it off, an endpoint with no sign-in rule and no PIN is reachable by anyone with the address.
- Auto-protect new endpoints — on by default. The first time a service is exposed, a sign-in rule for your own address is added.
Webhook endpoints are exempt from refuse-by-default: they cannot use the sign-in gate, so refusing would leave them unreachable.
Admin panel
Admin users have access to additional management features:
- User management: View all registered users, delete users
- Audit logs: View all admin actions (logins, key creation/deletion, etc.)
- Registration toggle: Enable/disable new user registration globally
- Server settings: Manage system configuration
All admin actions are logged with timestamps and user info for auditability.